Flexibility and agility in data visualisation
THE PROJECT
Recognising that innovation is a necessity to keep up with today’s business environment, the European Statistical System (ESS) Innovation Agenda aims to meet demands for timelier and more detailed statistics by applying new technologies to innovate statistical processes. This situation calls for ESS members to expand their use of digital technologies and widen the use of data sources, including new digital sources. As a part of this, statisticians need new and innovative tools to assist them with combining data visualisation and data analysis, which can be rapidly updated. The ‘customisable innovative tool’ project has been developed under the ESS Innovation Agenda and has created a generic ‘R-based tool’ for dissemination. ‘R’ is a programming language used mainly for data analysis and has various packages. Statistical tools used in R range from simple averages like mean and mode, to statistical tests like t-tests, and analysis of variants. The R-based software can be used to combine interactive graphical representation with text, making it feasible to convey (short) messages to the reader in a ‘story telling’ style. Once customised, the R-tool can very rapidly generate a set of html pages suitable for being published on a website, without security constraints. This is particularly fitted to information which must be updated frequently and rapidly, such as monthly monitoring of a set of statistical variables. Customisation options include the possibility to use a specific logo, insert text in a language different from English, update the displayed texts using simple input in files, and use graphs or tables formats to show statistical information. The tool offers several interactivity functionalities for graphs and other options, such as downloading graphs and sharing results on social media.

THE MOTIVATION
The project tool has been developed based on an existing Eurostat tool, which was developed internally and has received good feedback from users. The tool is customisable so that it can be used by Member State statistical agencies or other interested stakeholders. The updated tool is ideally suited for ensuring efficient and rapid statistical dissemination of data and analysis, which could be collected and compiled by statistical agencies and published for the public.
THE METHODOLOGY
Building on an existing Eurostat tool, the project developed R-based dissemination software. The next phase involves promoting the tool to Member States and other stakeholders. The eurostatRTool package is publicly available in a repository on Eurostat’s GitHub: https://github.com/eurostat/eurostatRTool. The repository also contains wiki pages with documentation: https://github.com/eurostat/eurostatRTool/wiki
MORE INFORMATION
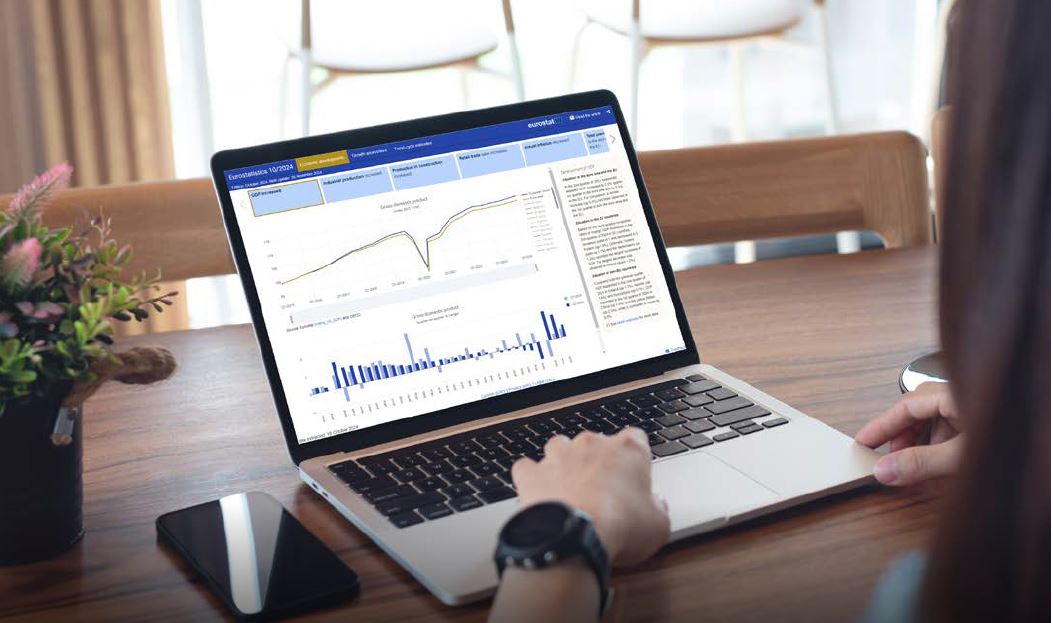
Tool: Visualisation of Eurostatistics 10/2024
Presentation of the tool: https://www.q2024.pt/programme/sessions
Source code: https://github.com/eurostat/eurostatRTool
THE TEAM
Project owner: ESS Directors of macroeconomic statistics (DMES)
Project lead: Eurostat Unit C1
Contact: ESTAT-EUROINDICATORS@ec.europa.eu
LAST UPDATE: January 2025
PARENT PAGE: