Many classification methods encountered in official statistics have a hierarchical structure (e.g. NACE, ISCO, ISCED, etc.). The national statistical institutes often conduct the assignment of these classifications manually, which requires significant resources and time. Hence, in order to expedite and assist this process, NSIs have been working on building hierarchical classification models using machine learning methods.
There are three main approaches to conducting a hierarchical classification 1) the flat classification approach, 2) the local classifier approach, and 3) the global classifier approach.
- The flat classification approach ignores the hierarchical structure and constructs a classifier that distinguishes between all the leaf nodes at the desired level of detail. While this method provides consistent predictions, its main disadvantage is that - depending on the regarded use case - it might have to differentiate between a significant number of classes.
- The local classifier can be categorised into three groups 1) the local classifier per node, 2) the local classifier per level, and 3) the local classifier per parent node. While the local classifier per node constructs a boolean classifier for each node in the tree, the local classifier per level trains one multiclass classifier for each level. However, both these classifiers can produce inconsistent predictions. In contrast, the local classifier per parent node approach only trains each parent node to distinguish between its child nodes, hence providing a consistent prediction by construction. However, an evident disadvantage of this method is that a misclassification at any level will inevitably be propagated downwards.
- Lastly, the global classifier approach trains a single classification model on the entire hierarchical structure in a single run. While this method provides consistent predictions and does not require the computation of multiple classifiers, its main drawback is its complexity.
For a detailed description of these different hierarchical classification approaches, see the survey by Silla (2011).
Whether a proposed model can assist the manual classification process will depend on its quality. Hence, suitable measures must be used to examine the quality of hierarchical classification models. The drawback of using standard measures such as precision, recall and accuracy to evaluate hierarchical machine learning models is their inability to account for the relationship or closeness between the true and predicted classes.
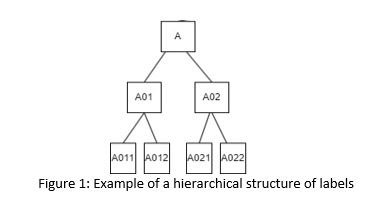
Consider the following example: suppose that A022 gives the actual third-level class of an entity, and model 1 predicts A021 and model 2 predicts A012; then, with respect to the standard evaluation metrics, both models perform equally poorly as they are both incorrect. However, the prediction of model 1 coincides with the actual code of the entity up to the second level (A02), hence providing a "closer" and, therefore, better estimate of the true level 3 code A022 (see Figure 1). Therefore, model 1 should not be penalised to the same extent as Model 2, as the degree of alignment between the true value and the predicted value provided by Model 1 is greater than that of Model 2. Accordingly, Sun and Lima (2001) proposed adjusted versions of the standard evaluation metrics, which account for the class relationships in a hierarchical structure, to provide a more accurate evaluation method for hierarchical models.
To quantify the closeness between two classes in a hierarchical structure, we can compute the 1) category similarity or the 2) category distance.
- In order to compute the category similarity, the most common measure of choice is the cosine similarity. The cosine similarity of two classes is defined as the cosine angle of their respective feature vectors. Thereby, the cosine similarity is solely computed between classes on the same level, as the aim is to compute the extent of similarity between the predicted and true class on each level separately. The higher the cosine similarity, the higher the degree of alignment between the respective two classes.
- The category distance is defined by the shortest path between two classes in the hierarchical structure. Similarly, the shorter the distance between two classes, the higher the degree of alignment between the respective two classes.
Once the closeness between the predicted and actual class is quantified, it is incorporated into the computation of the standard evaluation metrics (see Sun and Lima 2001), which can then be used to assess hierarchical models.
The adjusted standard evaluation measure based on category distance requires a hierarchical structure of the labels. Indeed, if there were no hierarchy, there would be only one level. Accordingly, the distance between the predicted and true class would either be zero (true and predicted class align) or one (true and predicted class do not align).
In contrast, the adjusted standard evaluation measure based on category similarity provides useful results even without a hierarchical structure of the labels. Indeed, as the category similarity is defined for each level of the hierarchy separately, it can also be computed for a flat classification structure which is a hierarchical structure with a single level. Therefore, it can be used in addition to the standard evaluation measures in flat classification problems.
An overview of the evaluation measures that can be used for the different hierarchical structures of labels is provided below:
Flat classification
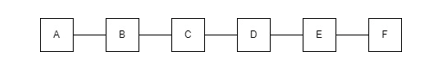
Suggested evaluation measures:
- Standard evaluation measures (precision, recall, accuracy)
- Adjusted standard evaluation measure based on category similarity
Hierarchical classification
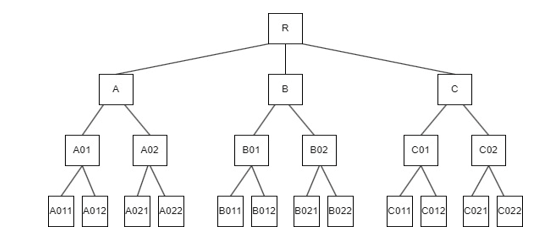
The Hierarchical structure of labels: Rooted tree, where all leaf nodes are on the same level
Suggested evaluation measures:
- Adjusted standard evaluation measure based on category similarity
- Adjusted standard evaluation measure based on category distance
- Hierarchy-based evaluation measures
The Hierarchical structure of lables: Rooted tree where all leaf nodes are on the same level
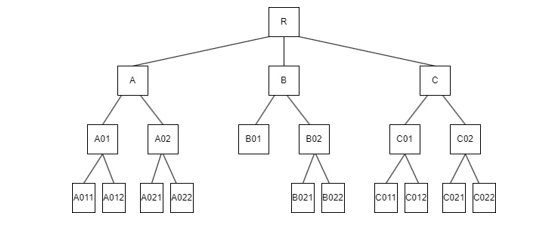
Suggested evaluation measures:
- Adjusted standard evaluation measure based on category similarity
- Adjusted standard evaluation measure based on category distance
- Hierarchy-based evaluation measures
For more information see:
https://unece.org/sites/default/files/2023-05/ML2023_S1_Austria_Mangat_Paper.pdf
References
Sun, Aixin, and Ee-Peng Lim (2001) "Hierarchical text classification and evaluation." In Proceedings 2001 IEEE International Conference on Data Mining, 521–528. IEEE
Kiritchenko, Svetlana, Stan Matwin, Richard Nock, and A Fazel Famili (2006). "Learning and evaluation in the presence of class hierarchies: Application to text categorisation." In Advances in Artificial Intelligence: 19th Conference of the Canadian Society for Computational Studies of Intelligence, Canadian AI 2006, Qu'ebec City, Qu'ebec, Canada, June 7-9, 2006. Proceedings 19, 395–406. Springer.
Silla, Carlos N., and Alex A. Freitas. 2011. "A survey of hierarchical classification across different application domains." Data Mining and Knowledge Discovery 22:31–72.
Published June 2023